Sample Size Calculator
Results (Forward)
Multi-Confidence Table
Based on your Margin of Error and Response Distribution.
| Confidence Level | Z-score | Sample Size (∞ population) | Sample Size (finite pop) |
|---|
Results (Reverse)
Determining the right sample size can make or break your research project. Too small, and your findings won’t represent your target population. Too large, and you’re wasting valuable time and resources. The Raosoft sample size calculator has become the go-to solution for researchers, students, and data analysts who need accurate sample size calculations quickly and efficiently.
Understanding Key Sample Size Concepts
Before diving into the calculator itself, it’s essential to grasp the fundamental concepts that drive sample size calculations.
Sample Size
Sample size refers to the number of participants or observations you include in your study. This number directly impacts the reliability and validity of your research findings. A well-calculated sample size ensures your results accurately reflect the characteristics of your entire target population.
The challenge lies in finding the sweet spot large enough to be statistically meaningful, yet practical enough to execute within your constraints of time, budget, and resources.
Margin of Error
The margin of error represents the amount of uncertainty you’re willing to accept in your results. Expressed as a percentage, it creates a range around your sample statistic within which the true population parameter likely falls.
For instance, if your survey reveals that 60% of respondents prefer a particular product with a margin of error of ±3%, you can be confident that between 57% and 63% of the entire population shares this preference. Common margin of error values range from 1% to 10%, with 5% being widely accepted across many research fields.
Confidence Level
Your confidence level indicates how certain you can be that your sample results fall within the specified margin of error. This statistical measure is expressed as a percentage, with 90%, 95%, and 99% being the most frequently used levels.
A 95% confidence level means that if you repeated your study 100 times with different samples from the same population, approximately 95 of those studies would produce results within your margin of error. Higher confidence levels provide greater certainty but require larger sample sizes.
Population Size
Population size represents the total number of individuals in your target group. Interestingly, for populations exceeding 20,000 people, the actual population size has minimal impact on your required sample size. However, for smaller populations, this factor becomes increasingly important in your calculations.
Response Distribution
Response distribution reflects the expected variability in your survey responses. A 50% response distribution assumes maximum variability, where responses are split evenly between options. This conservative approach typically yields the largest recommended sample size, making it the safest choice when you’re uncertain about response patterns.
How to Use the Raosoft Calculator: A Step-by-Step Guide
Using the Raosoft sample size calculator is straightforward, but understanding each input ensures accurate results.
Step 1: Set Your Margin of Error
Begin by determining your acceptable margin of error. Enter this value as a percentage in the designated field. Remember that lower margins of error require larger sample sizes but provide more precise results.
Step 2: Choose Your Confidence Level
Select your desired confidence level from the dropdown menu. Most academic research uses 95%, while market research often accepts 90%. Critical medical or safety studies may require 99% confidence.
Step 3: Enter Population Size
Input your total population size. If you’re studying a very large or unknown population, use 20,000 or higher, as the calculator’s recommendations won’t change significantly beyond this point.
Step 4: Set Response Distribution
Unless you have specific expectations about response patterns, leave this at 50%. This conservative approach ensures your sample size will be adequate regardless of how responses actually distribute.
Step 5: Calculate and Review Results
Click calculate to receive your recommended sample size. The tool also provides alternative scenarios, showing how different confidence levels or sample sizes would affect your margin of error.
Example Calculation
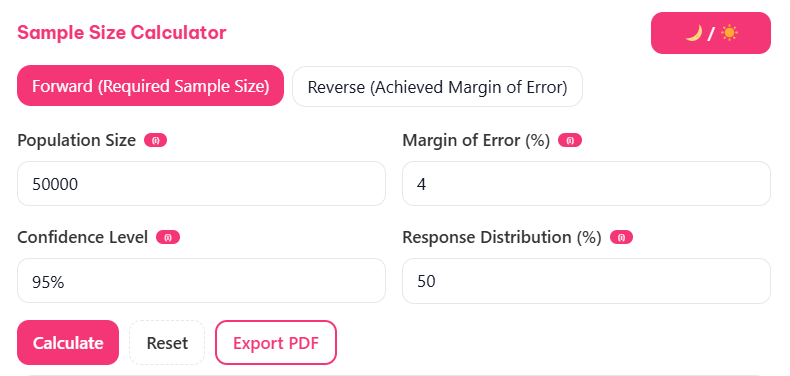
Let’s work through a practical example. Suppose you’re conducting market research for a new product launch:
- Margin of Error: 4%
- Confidence Level: 95%
- Population Size: 50,000 potential customers
- Response Distribution: 50%
The calculator recommends a sample size of 601 respondents. This means surveying 601 people would give you 95% confidence that your results are within 4% of the true population values.
Interpreting Your Results
Understanding your calculator results goes beyond simply noting the recommended sample size. The tool provides valuable insights that can inform your research strategy.
Minimum Sample Size
The primary result shows the minimum number of participants needed to meet your specified statistical requirements. This represents the threshold for reliable results, assuming you achieve 100% response rate from your selected sample.
Alternative Scenarios
Pay attention to the alternative scenarios section. This feature demonstrates how adjusting your parameters affects sample size requirements. For example, you might discover that accepting a slightly larger margin of error could significantly reduce your sample size needs, making your study more feasible.
Practical Considerations
Remember that the calculated sample size assumes random sampling and 100% response rates. In reality, you’ll need to account for non-responses, incomplete surveys, and potential sampling limitations. Many researchers add a 10-20% buffer to their calculated sample size to compensate for these factors.
Real-World Applications of Sample Size Calculations
Understanding how different industries and research contexts apply sample size calculations helps illustrate the tool’s versatility.
Market Research
A company developing a new smartphone wants to understand consumer preferences across different age groups. Using the Raosoft calculator, they determine they need 384 respondents for a 95% confidence level with a 5% margin of error. This sample size ensures their product development decisions are based on statistically reliable consumer insights.
Political Polling
A polling organization preparing for election coverage calculates sample sizes for different demographic segments. For statewide polls, they use 1,068 respondents to achieve 95% confidence with a 3% margin of error. This precision allows them to make accurate predictions while efficiently allocating their surveying resources.
Healthcare Surveys
A hospital system evaluating patient satisfaction across its network of facilities needs reliable feedback data. They calculate a sample size of 322 patients per facility for 95% confidence with a 5% margin of error. This approach ensures each facility’s results are statistically meaningful while keeping the survey manageable.
Academic Research
A university researcher studying student learning outcomes in online versus traditional courses needs sufficient sample sizes for both groups. Using the calculator, they determine that 246 students per group will provide 95% confidence with a 6% margin of error, making their comparative analysis statistically robust.
Quality Control
A manufacturing company implements statistical quality control processes for their production line. They use sample size calculations to determine how many products to inspect hourly, ensuring they can detect quality issues with 99% confidence while maintaining efficient production schedules.
The Importance of Sample Size in Research Success
Proper sample size calculation forms the foundation of credible research. Undersized studies may miss important effects or relationships, while oversized studies waste resources that could be better allocated elsewhere.
Statistical Power
Adequate sample sizes ensure your study has sufficient statistical power to detect meaningful differences or relationships. Underpowered studies often produce inconclusive results, potentially requiring costly follow-up research.
Resource Optimization
Calculating optimal sample sizes helps balance statistical rigor with practical constraints. You’ll avoid the expense of unnecessarily large samples while ensuring your results meet scientific standards.
Credibility and Publication
Research with properly calculated sample sizes is more likely to be accepted by peer reviewers and journal editors. Clear justification of sample size decisions demonstrates methodological rigor and statistical competence.
Frequently Asked Questions
What if my population size is infinite or unknown?
When dealing with very large or unknown populations, use a large number such as 1,000,000 in the population size field. For populations larger than 20,000, the sample size doesn’t change significantly, so any large number will provide accurate results.
How does changing the confidence level affect the sample size?
Increasing your confidence level requires a larger sample size because you’re demanding greater certainty in your results. Moving from 90% to 95% confidence typically increases sample size requirements by about 40%, while jumping to 99% confidence nearly doubles the needed sample size.
Can I use the Raosoft calculator for qualitative research?
The Raosoft calculator is specifically designed for quantitative research involving numerical data and statistical analysis. Qualitative research typically uses different approaches to determine appropriate sample sizes, focusing on data saturation rather than statistical power.
Maximize Your Research Impact
The Raosoft sample size calculator serves as an invaluable tool for researchers across disciplines. By understanding the key concepts, following proper procedures, and interpreting results correctly, you can design studies that produce reliable, actionable insights while making efficient use of your resources.
Remember that sample size calculation is just the beginning of good research design. Consider factors such as sampling methods, survey design, data collection procedures, and analysis plans to ensure your study achieves its objectives.
Ready to determine the perfect sample size for your next research project? Calculate your sample size today using our comprehensive understanding of these principles, and take the first step toward conducting research that makes a meaningful impact in your field.